I explained previously that I believe that it is possible to predict future adoption rates and market share of sales for EVs. Specifically, I proposed that a suitable approach would be to apply what we know of EV market share so far to a suitably scaled innovation adoption S-curve on the core assumption that EVs will follow a suitable uptake to iPods, smartphones, flat-screen televisions and other consumer technologies.
The particular S-curve being considered is a form of logistic function, so named by the French mathematician Pierre François Verhulst who studied it in relation to population growth. The initial stage of growth is approximately exponential; then, as saturation begins, the growth slows, and at maturity, growth stops.
I don’t want to get bogged down in mathematical details so it should suffice to say that we are solving an equation of the form:
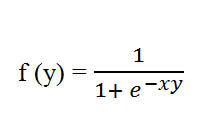
where we are trying to find x, essentially a scale factor, so that the market share for a particular year y matches what we expect (i.e. the known market share for electric vehicles since their recent relaunch). Finding a match also gives us the year from which to count y.
We know the monthly market share values for EVs for recent years so from the same source we can get annual totals. For the purpose of this discussion I am considering only the UK sales for the years 2011, 2012, 2013 and 2014 since the recent market growth was kick-started by the UK government’s Plug-In Car Grant which began on 1 January 2011. The figures I have from SMMT for 2011, 2012 and 2013 are given in Table 1. For 2014 I am using the latest figure reported, that for March 2014.
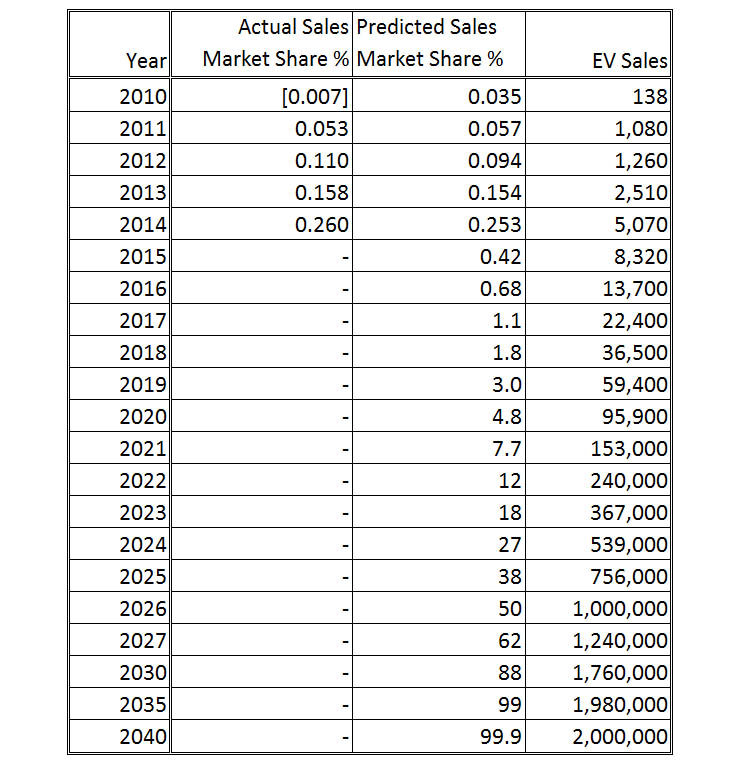
From an analysis of the results of various values for the scale factor I have come to the value of x = 0.498 as the best match. In other words, based on the limited data so far, if EV sales market share is following a technology adoption S-curve and if it continues to do so then I predict sales market share to be:
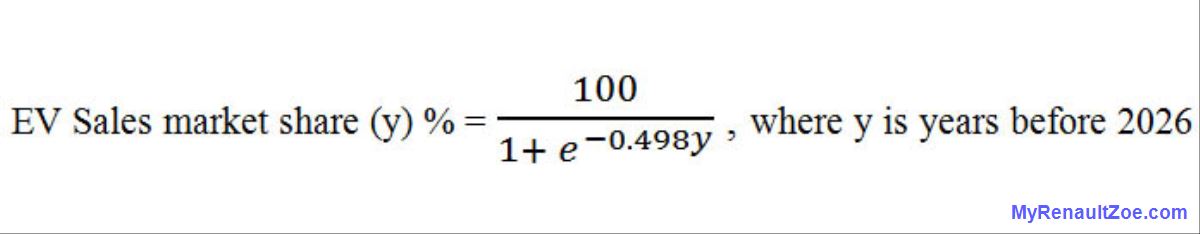
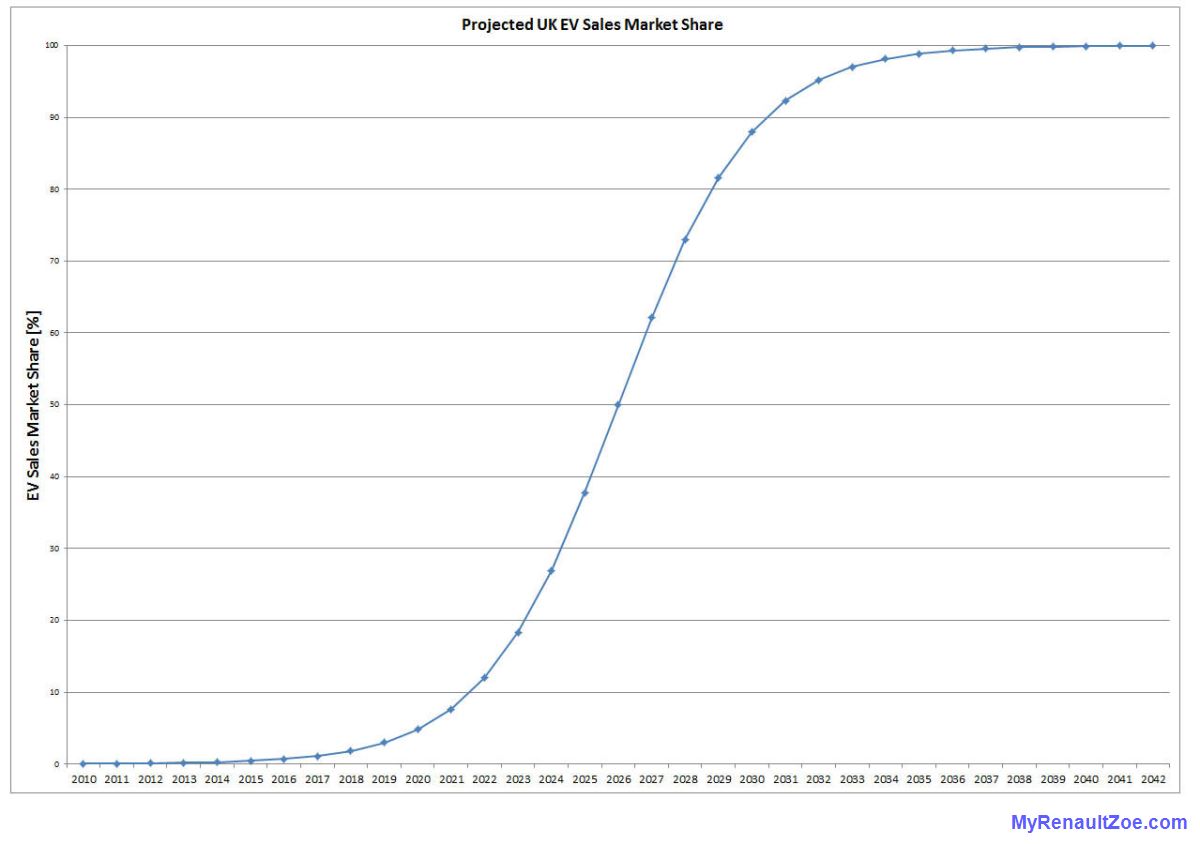
On this basis I have added into Table 1 the market share of sales that this gives for the known years, so it is possible to judge how well it fits. In addition, I have shown what it predicts for representative future years. Further, I have shown what this translates to in terms of sales of electric cars (assuming the UK market continues at its current rate of two million car sales per year). The market share values are also charted in Figure 1.
In broad brushstrokes, here are some interesting projections that this result gives us:
- The changeover from internal combustion engine cars to electric cars will take 32 years, from 2010 to 2042.
- The key year is 2026 – in this year more than half of all cars sold will be electric. In other words, in 2026 the default type of car sold is the electric car, with other fuel types in the minority.
- In 2014 we are already 4 years in to the changeover, so there are just 12 years left until the 2026 crossover point.
- Although the complete changeover (so that effectively ICE cars are no longer sold) takes a considerable amount of time, even by 2030 some nine out of ten cars sold will be electric.
- It is expected that sales at the start are low, as they currently are, but they will rise quickly. Market share of new sales will be just 2% by 2018 but 5% by 2020 and 25% by 2024.
- The decade from 2020 to 2030 will see a dramatic influx of electric cars, from 5% of new cars in 2020 to 90% in 2030.